
OrcaSlicer
The most recent builds can be found here. (Mac, Linux, Windows)
We provide a forked version of OrcaSlicer with Helio-Additive services baked in, where users can run simulations directly from the slicer, and view the thermal quality index for each part of the print.
This feature helps in predicting heat distribution and potential thermal issues during the printing process, ultimately allowing process engineers and 3d printing enthusiasts better interpretability of process settings and improved print quality, times and part performance.
Initial set up
Section titled “Initial set up”Supported printers
Section titled “Supported printers”Enable default Bambu Lab printers profiles for the following printers:
- Bambu Lab X1 Carbon
- Bambu Lab X1E
The Helio Additive printer data is already included in those profiles, so no extra configuration is needed.
The Helio Additive printer data is already included in those profiles, so no extra configuration is needed.
Supported materials
Section titled “Supported materials”Enable supported materials by selecting the default Orca Slicer profiles for the following:
| • Bambu ABS | • Bambu PLA Basic |
| • Bambu PLA Matte | • Bambu PLA Silk+ |
| • Bambu PC | • Bambu PETG HF |
| • Bambu TPU 95A HF | • Fiberon™ PA6-CF |
| • Fiberon™ PA6-GF | • Fiberon™ PA12-CF |
| • Fiberon™ PA612-CF | • Fiberon™ PET-CF |
| • Fiberon™ PETG-ESD | • Fiberon™ PETG-rCF |
| • PolyLite™ ABS | • PolyLite™ ASA |
| • PolyLite™ PETG | • PolyLite™ PLA |
| • PolyTerra™ PLA |
Enable Helio Options
Section titled “Enable Helio Options”Navigate to: Preferences > Helio Options > Enable Helio
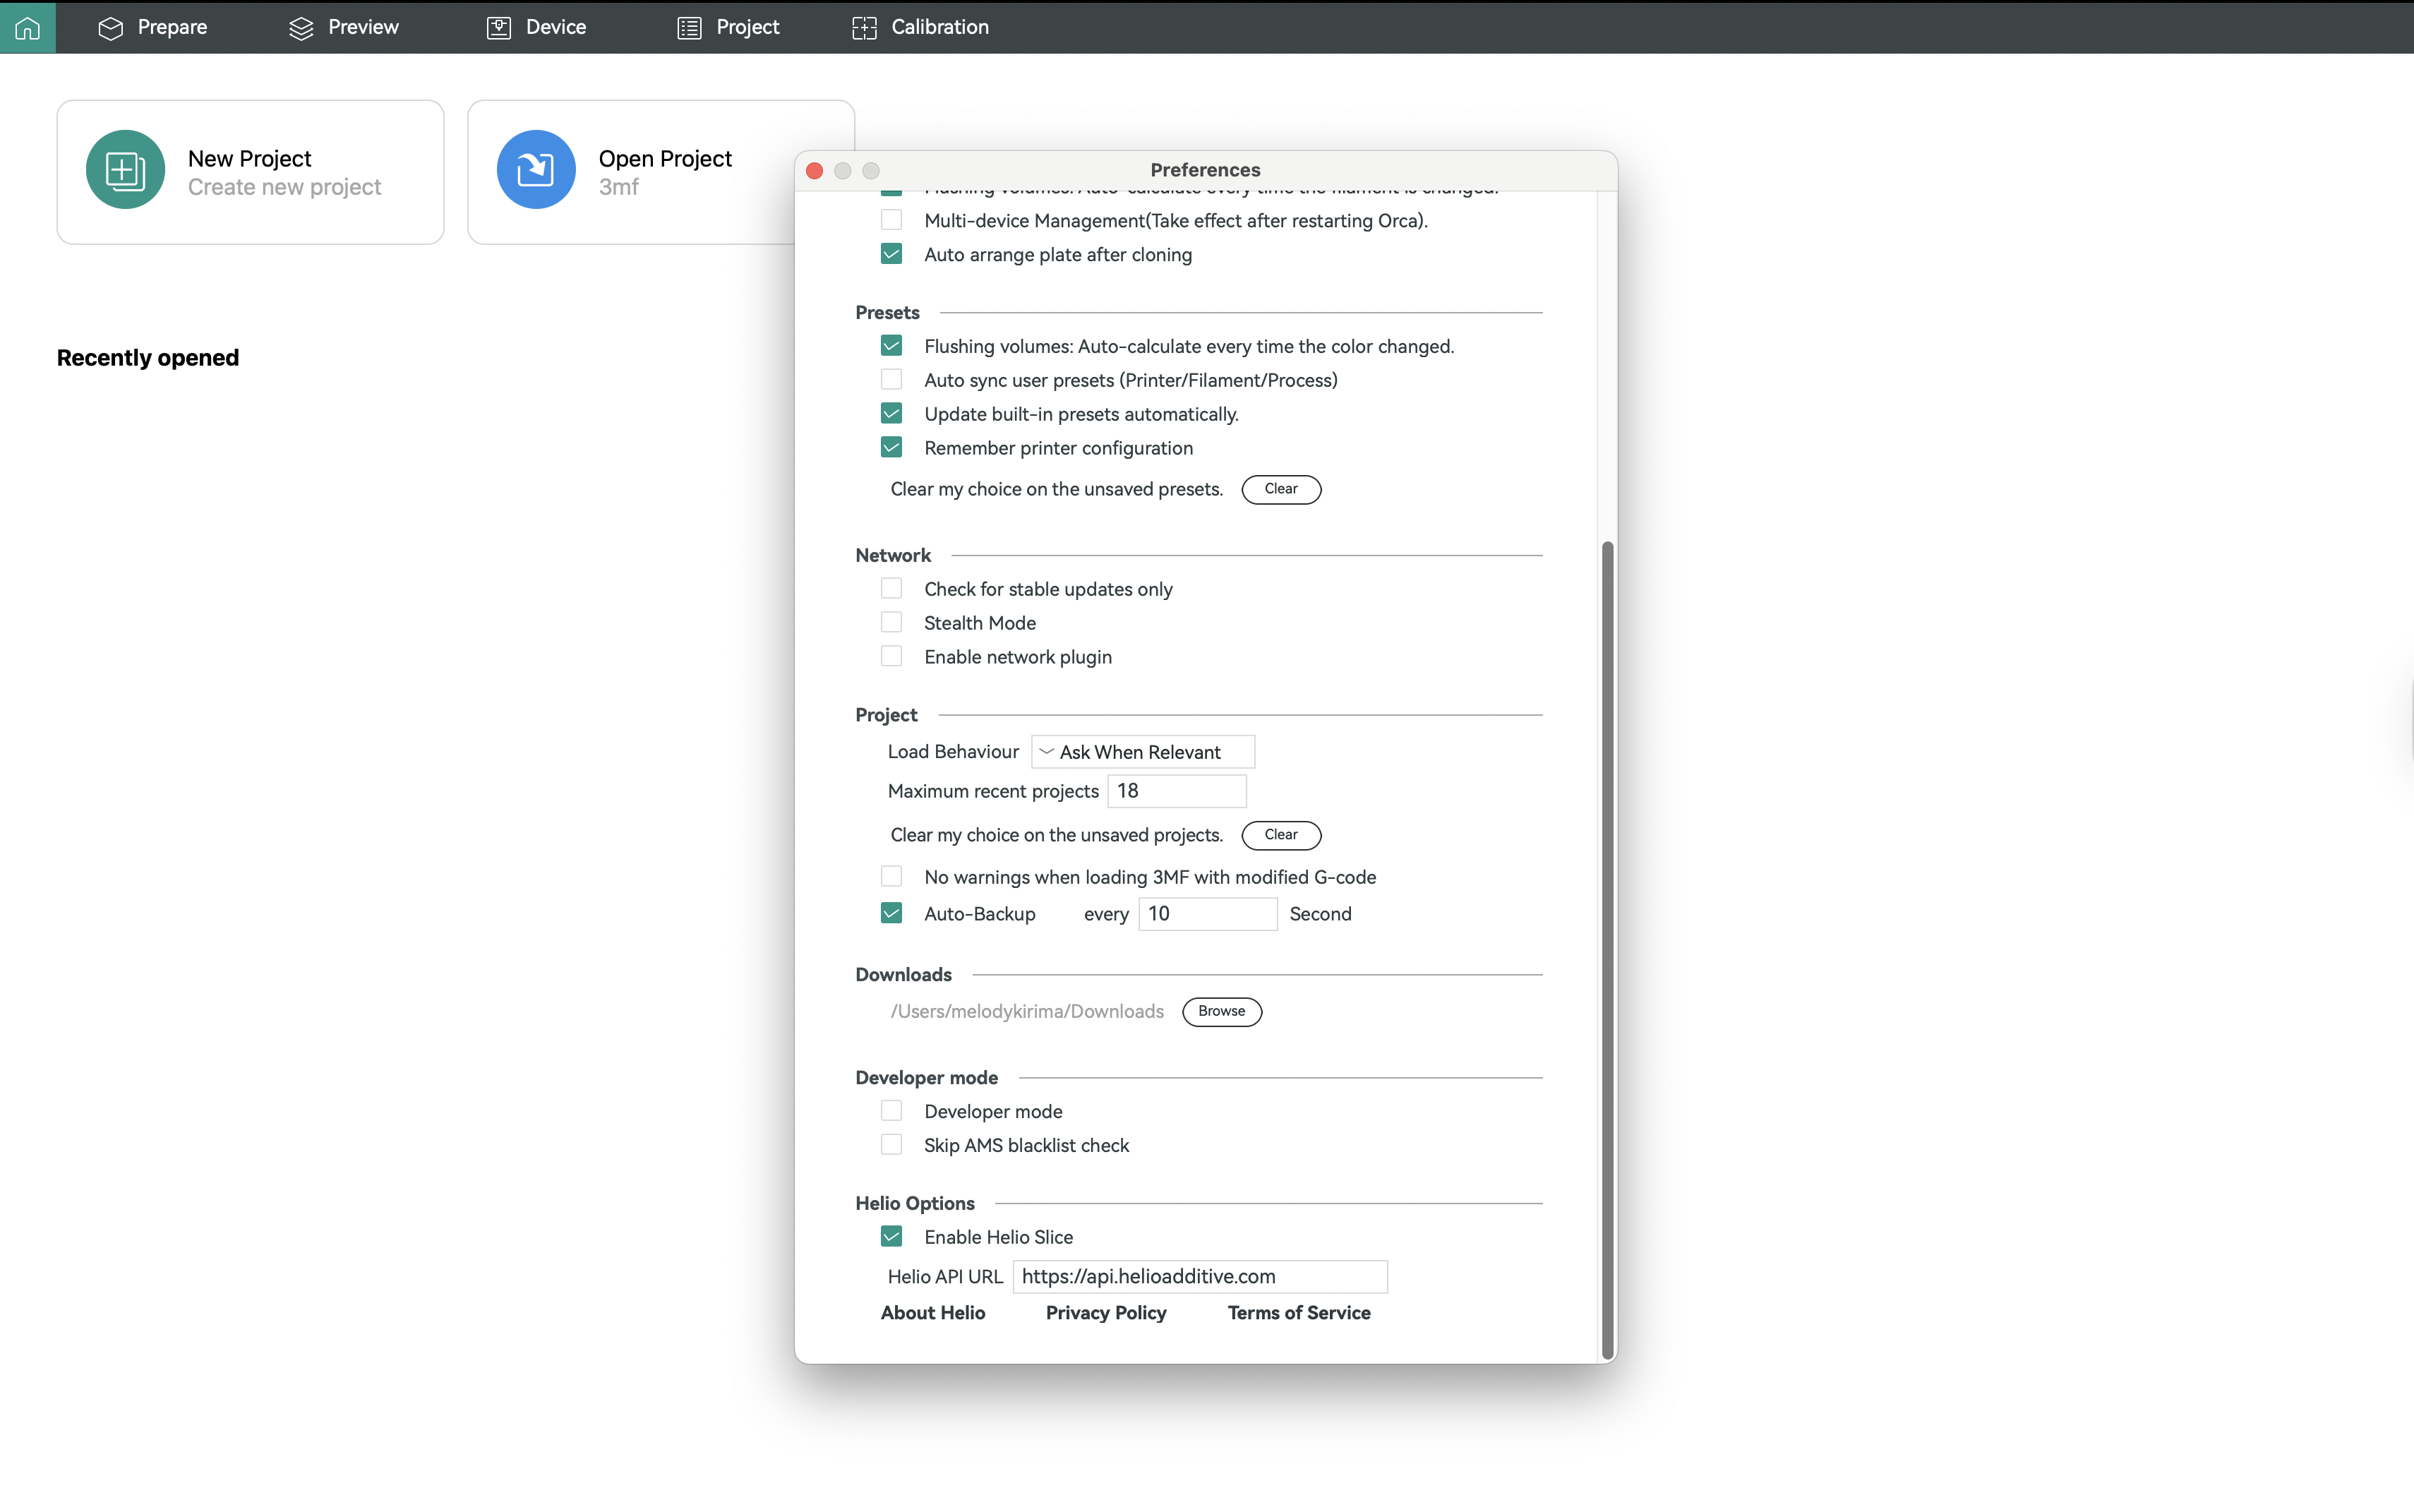
⚠️ Do not change the API endpoint. This is used for internal testing.
Slice your model
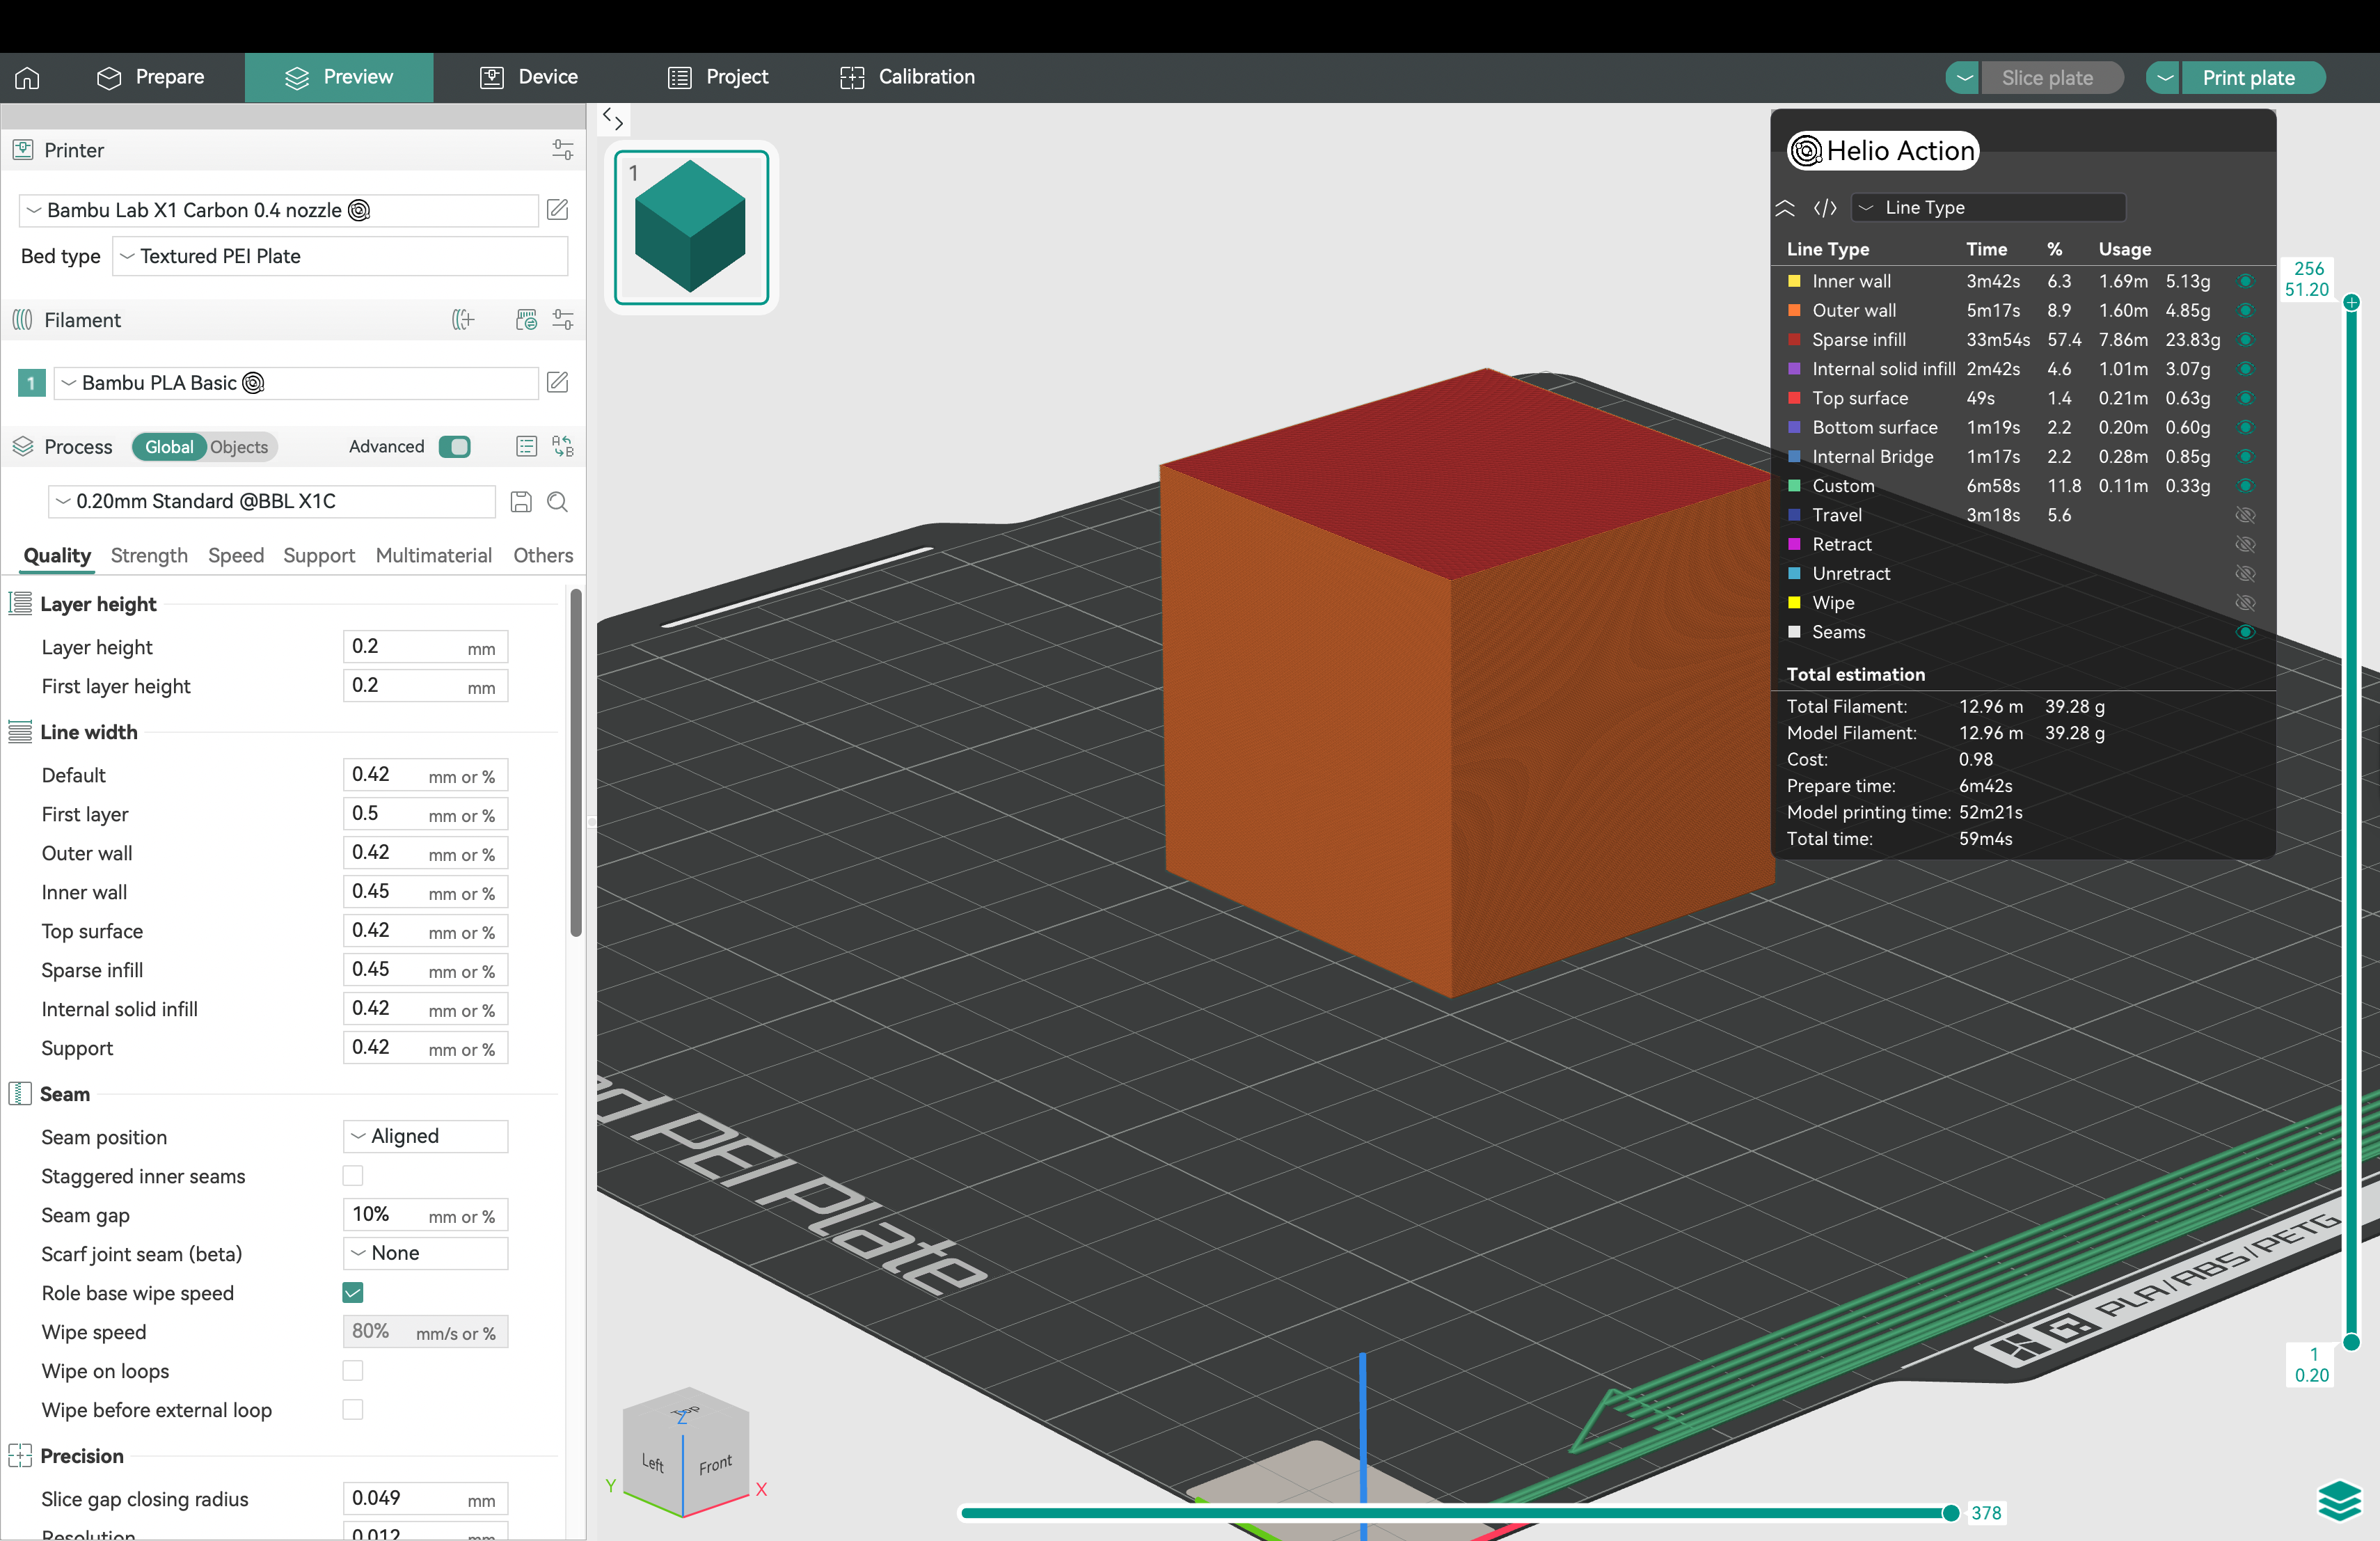
Section titled “Slice your model”Slice your model in Orca Slicer as usual:
Simulating
Section titled “Simulating”Go to 'Helio Action' > Enter your chamber temperature> OK:
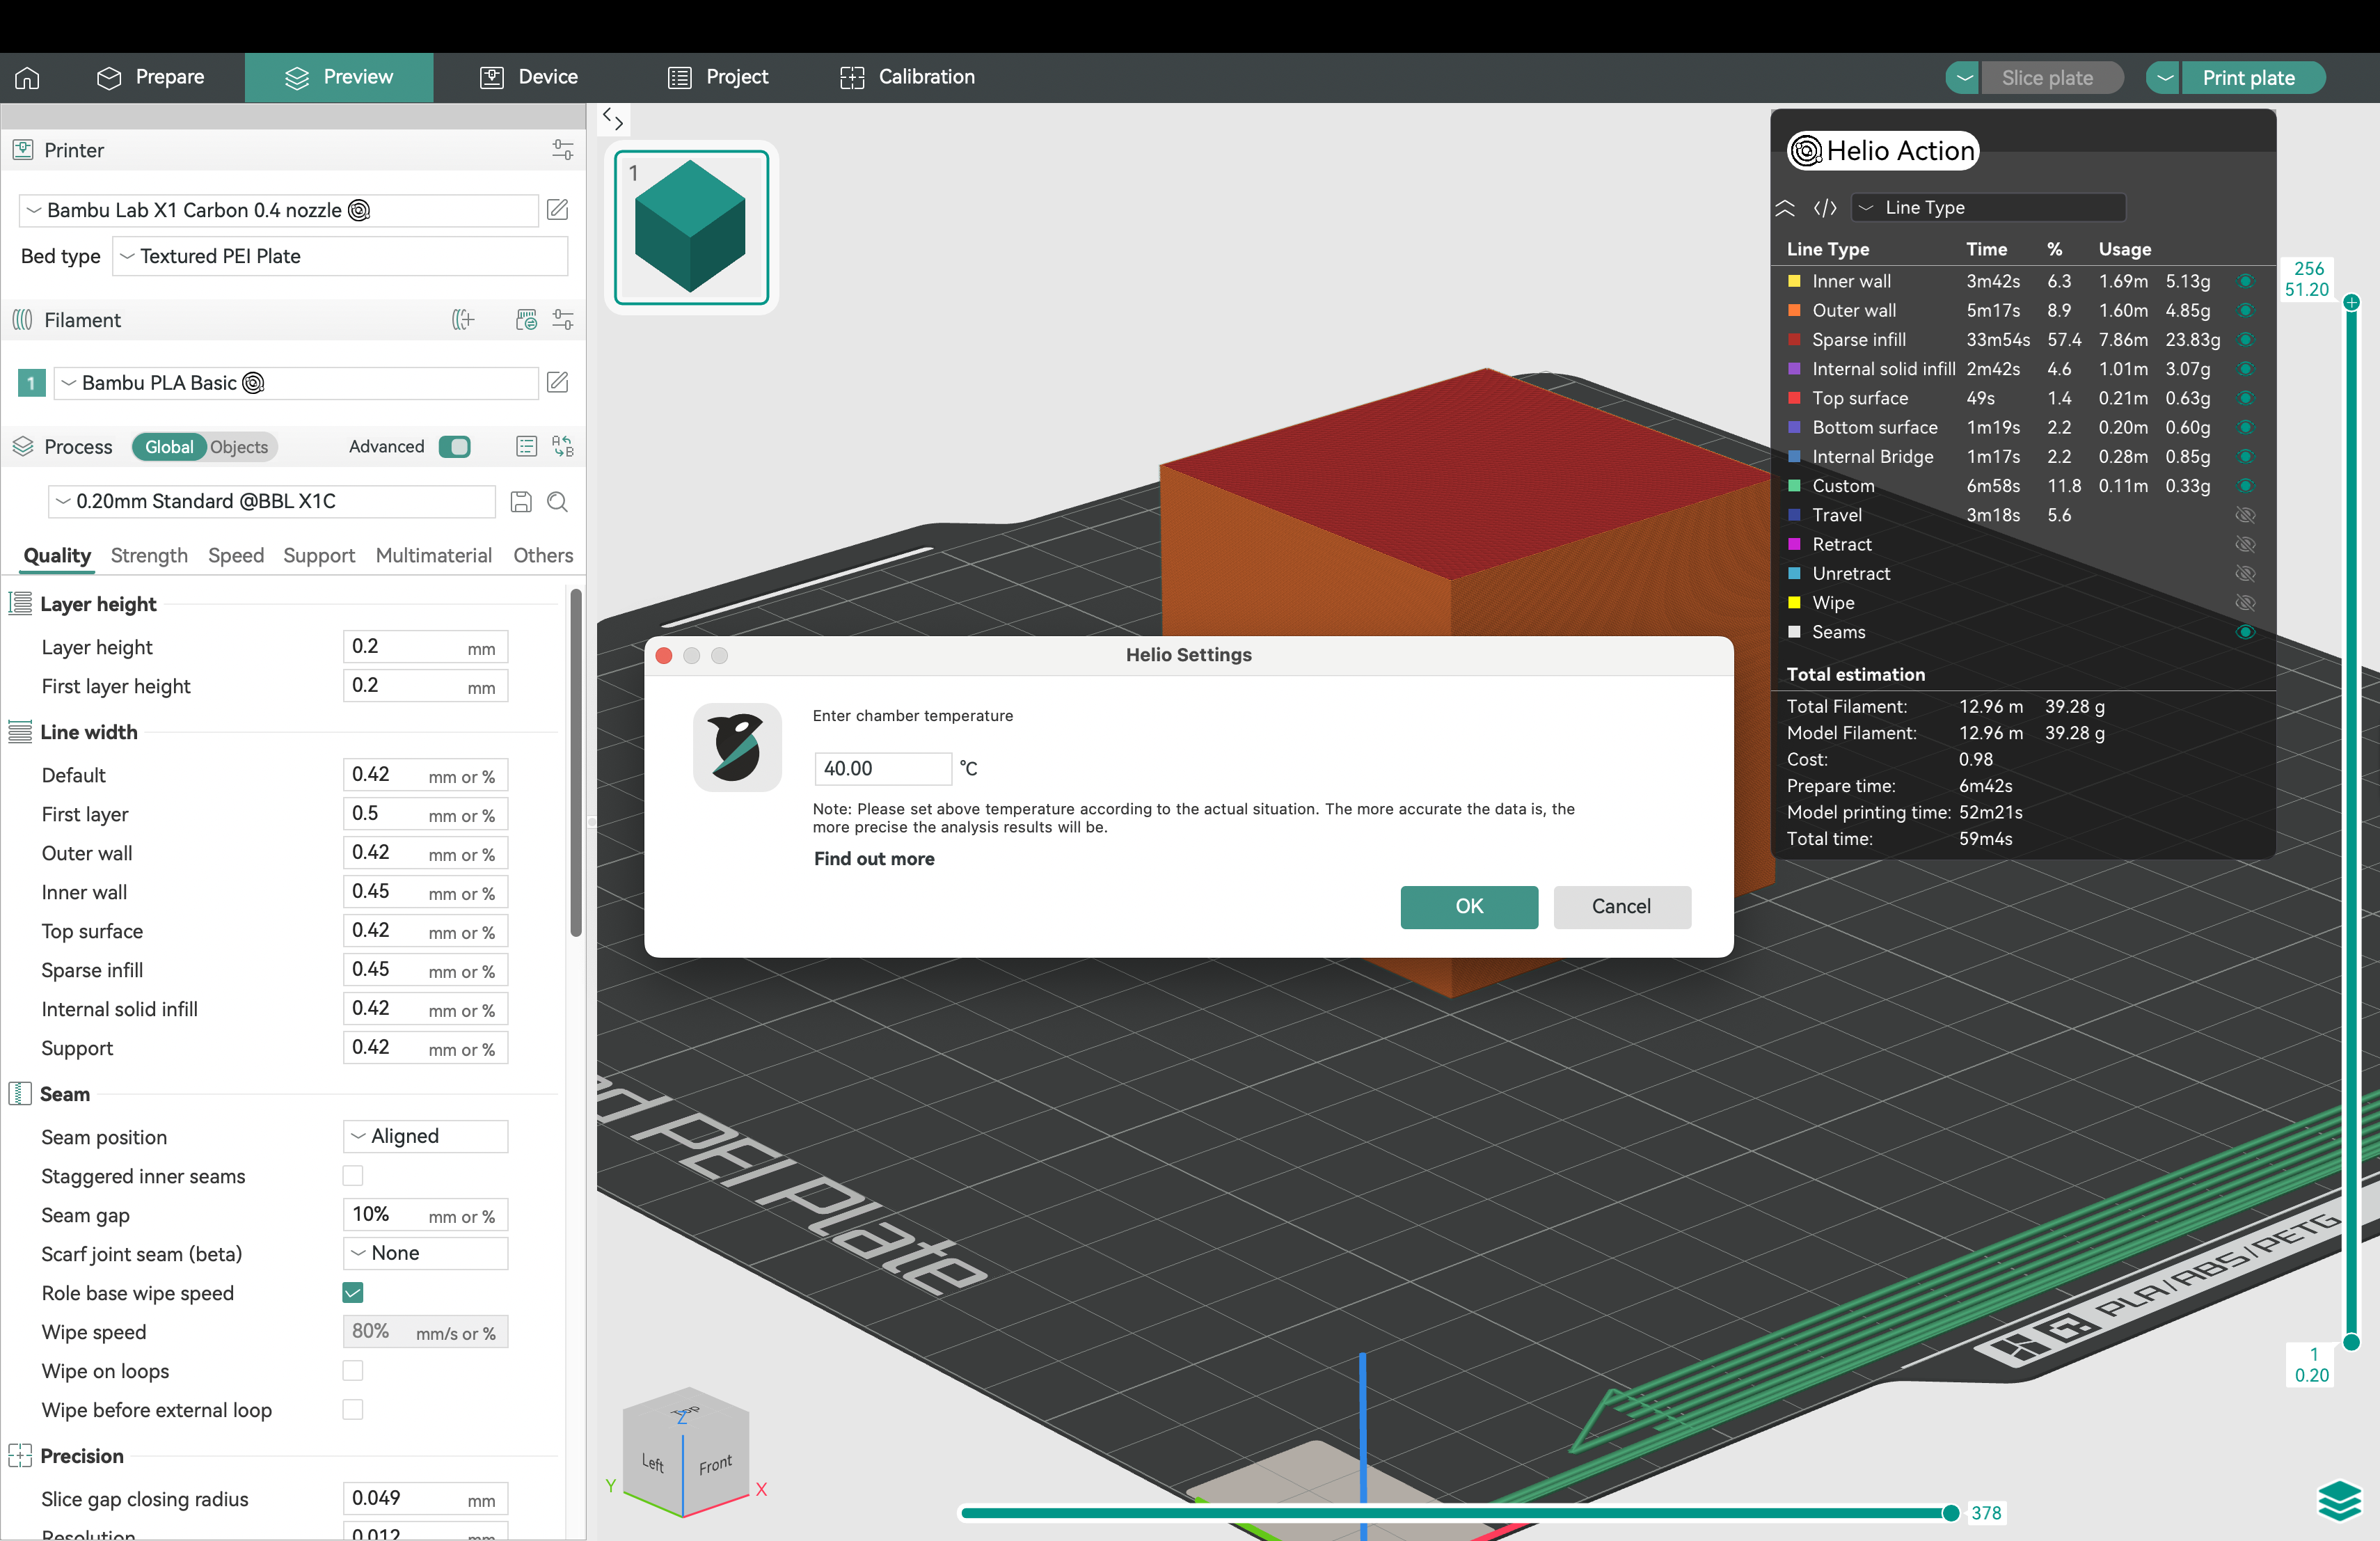
This will start the simulation
What is ‘chamber temperature’ in this case and how do I determine it?
To get accurate thermal simulations, we need the ambient temperature around your print—that is, the temperature of the air around your object while it prints.
The best way is to measure the temperature inside your printer’s chamber after your bed has been heated to the required temperature. Printers with enclosed chambers with sensors like the X1C show this info on the screen.
How does the simulation work?
OrcaSlicer will internally upload that G-Code to our services where we run a simulation of the print, and return back an annotated G-Code which contains a thermal index for all parts of the print.
⚠️ File Requirements:
- G-code must be monochrome and sliced by layer sequence (no multicolour/multi-material support yet).
- Must be single-object and single-plate. If multi-plate, only the first plate will be simulated.
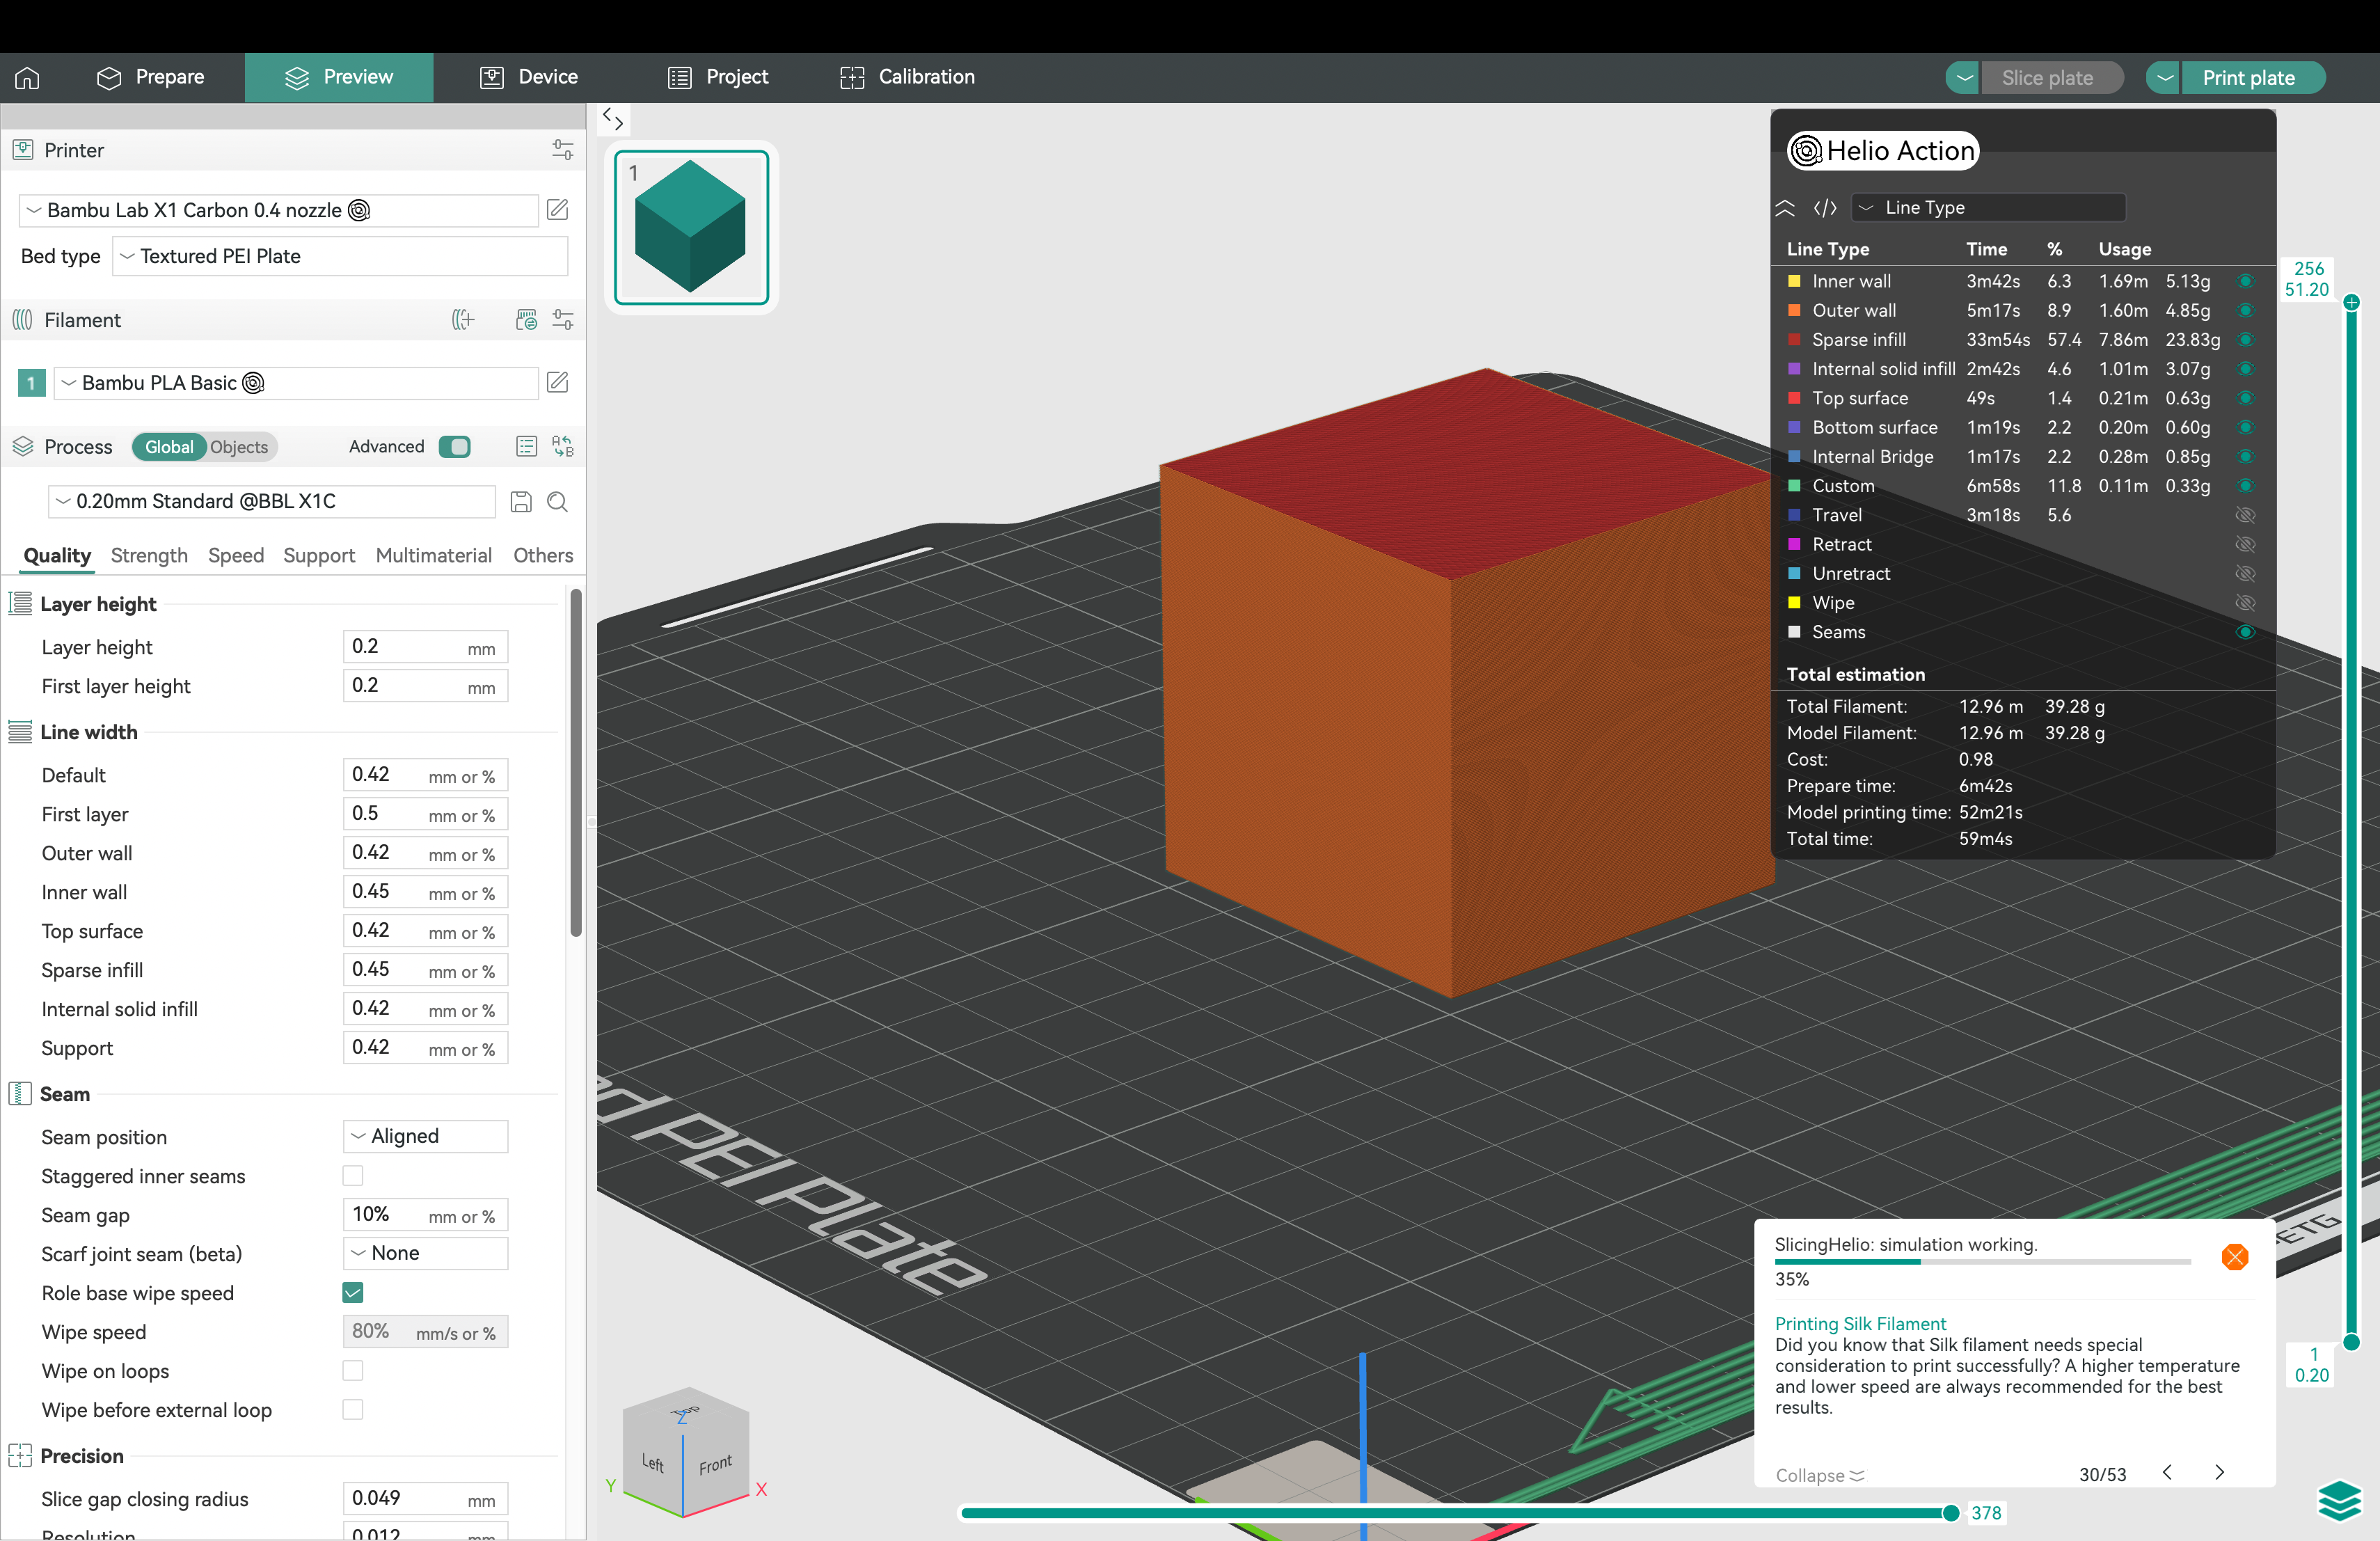
Wait for the simulatio to finish running
Section titled “Wait for the simulatio to finish running”Monitor your simuation results via the progress bar at the bottom-left of the screen:
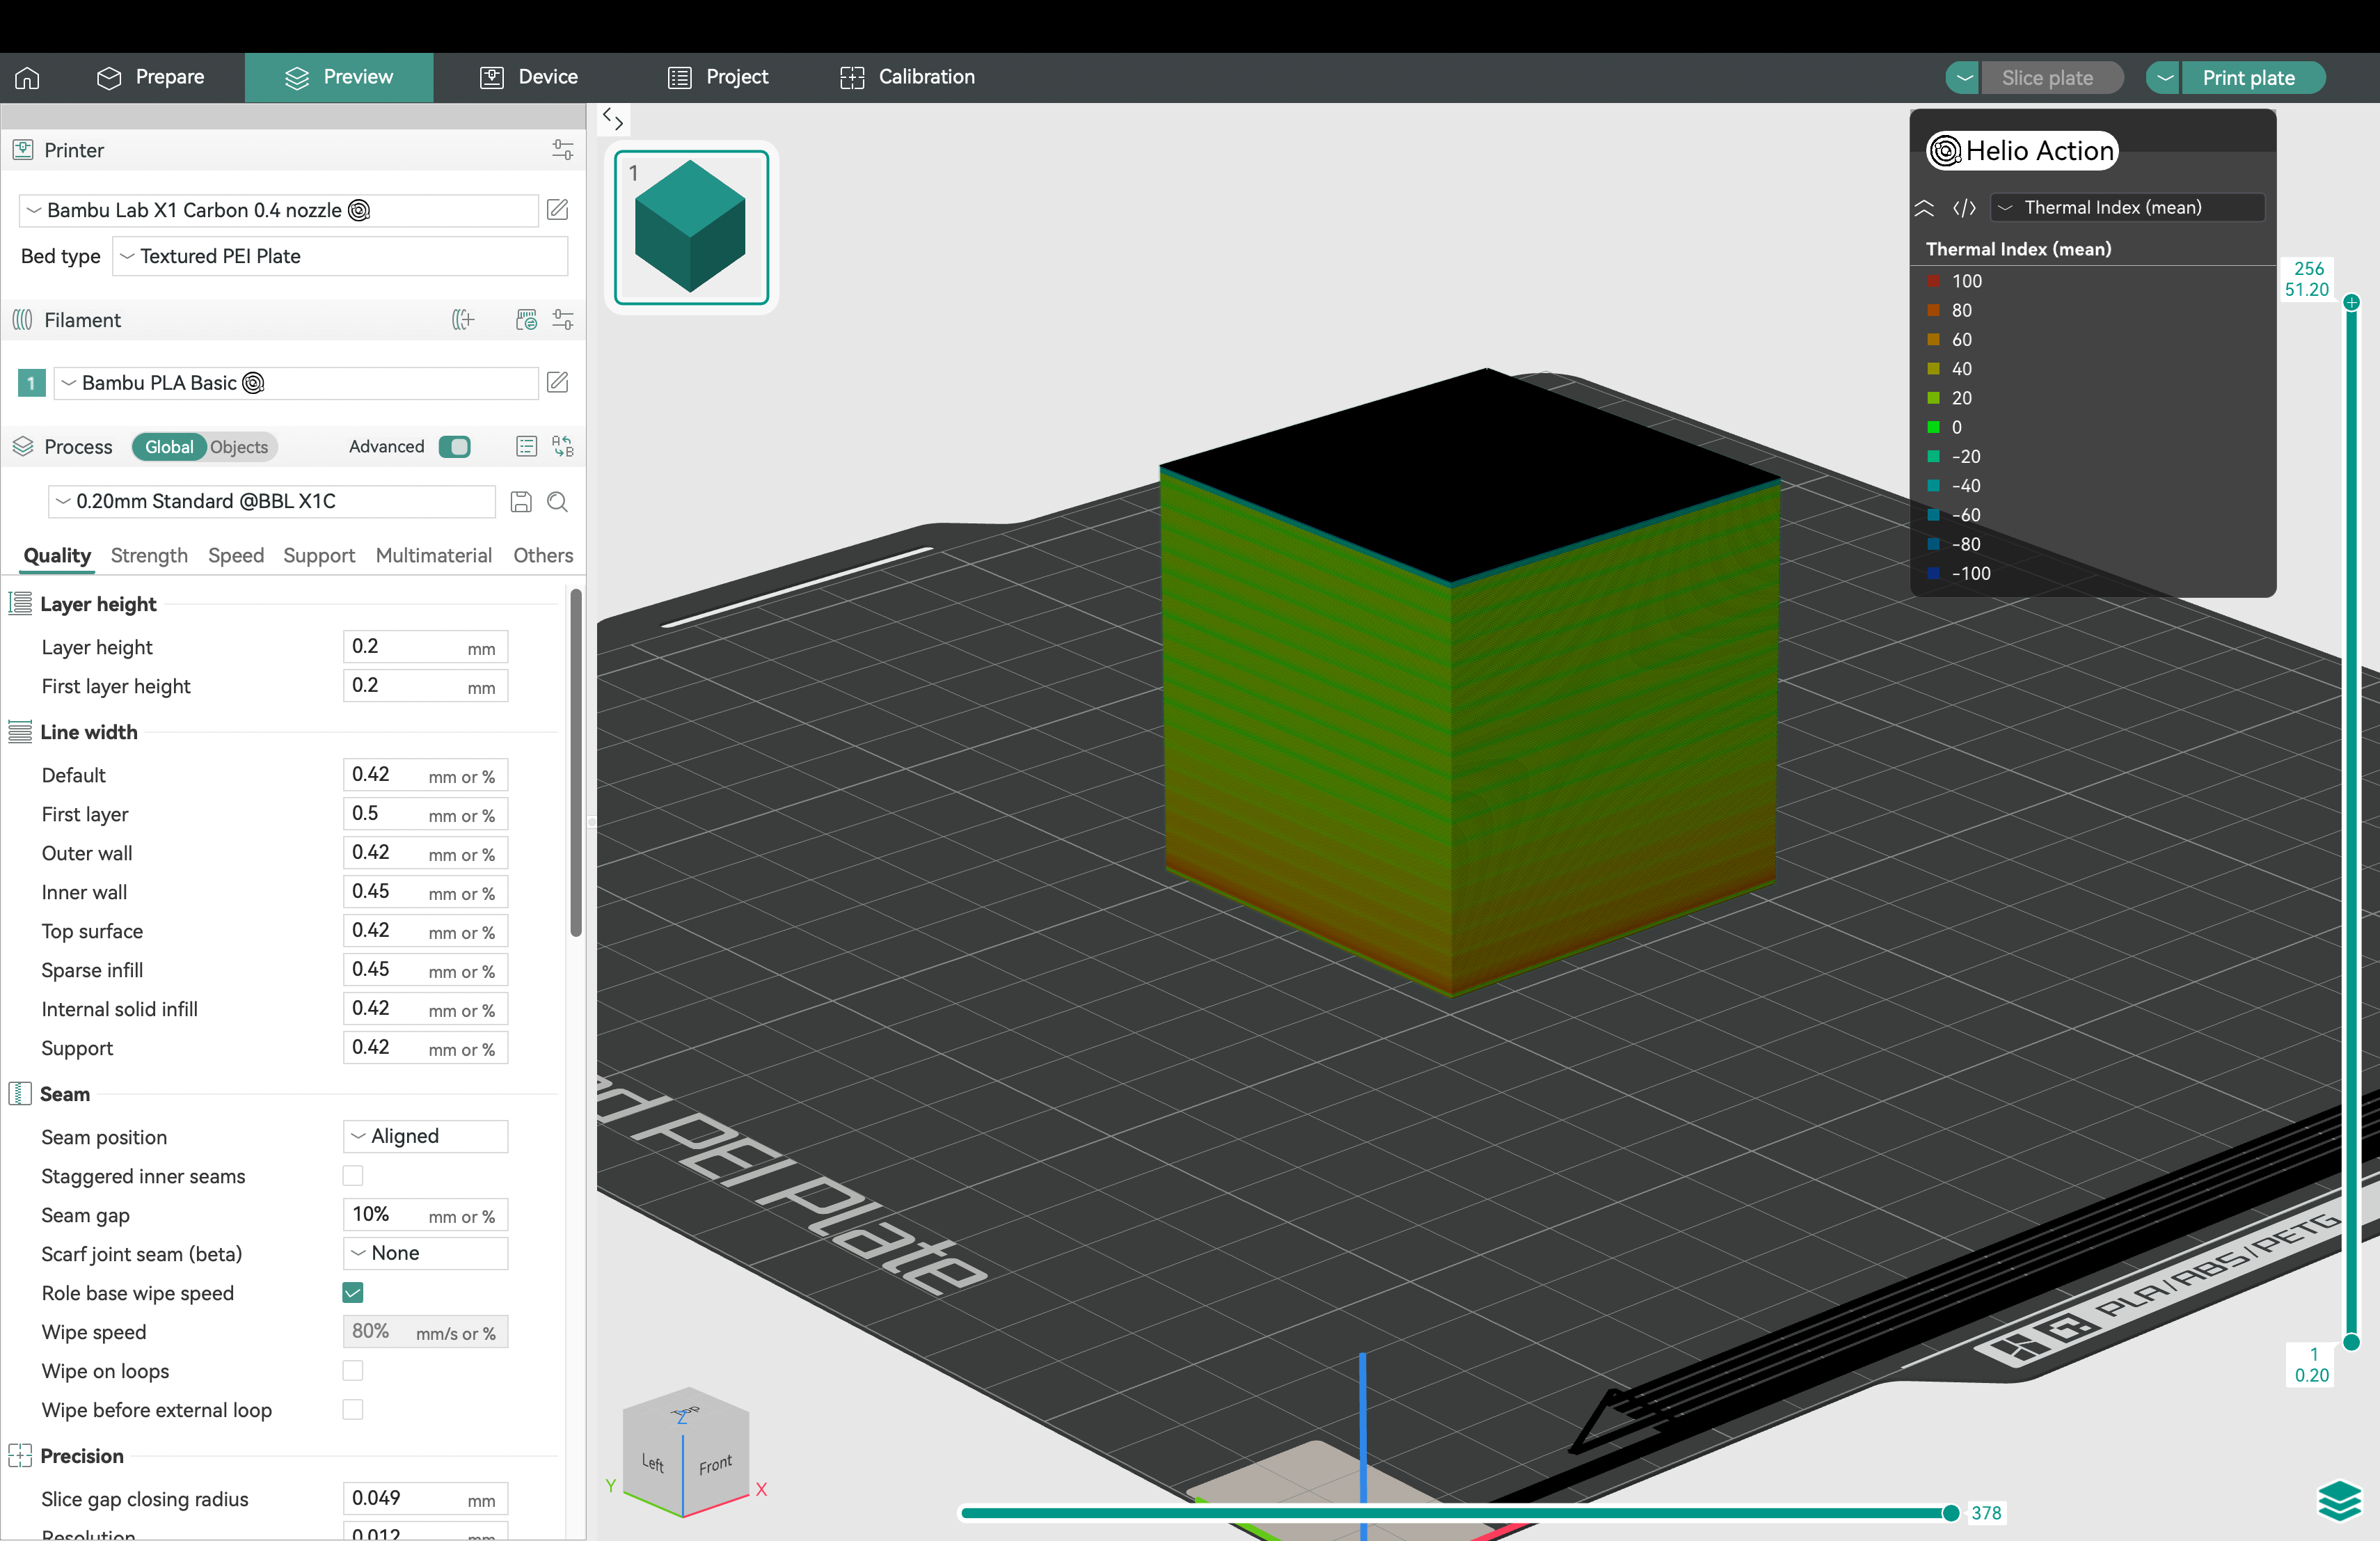
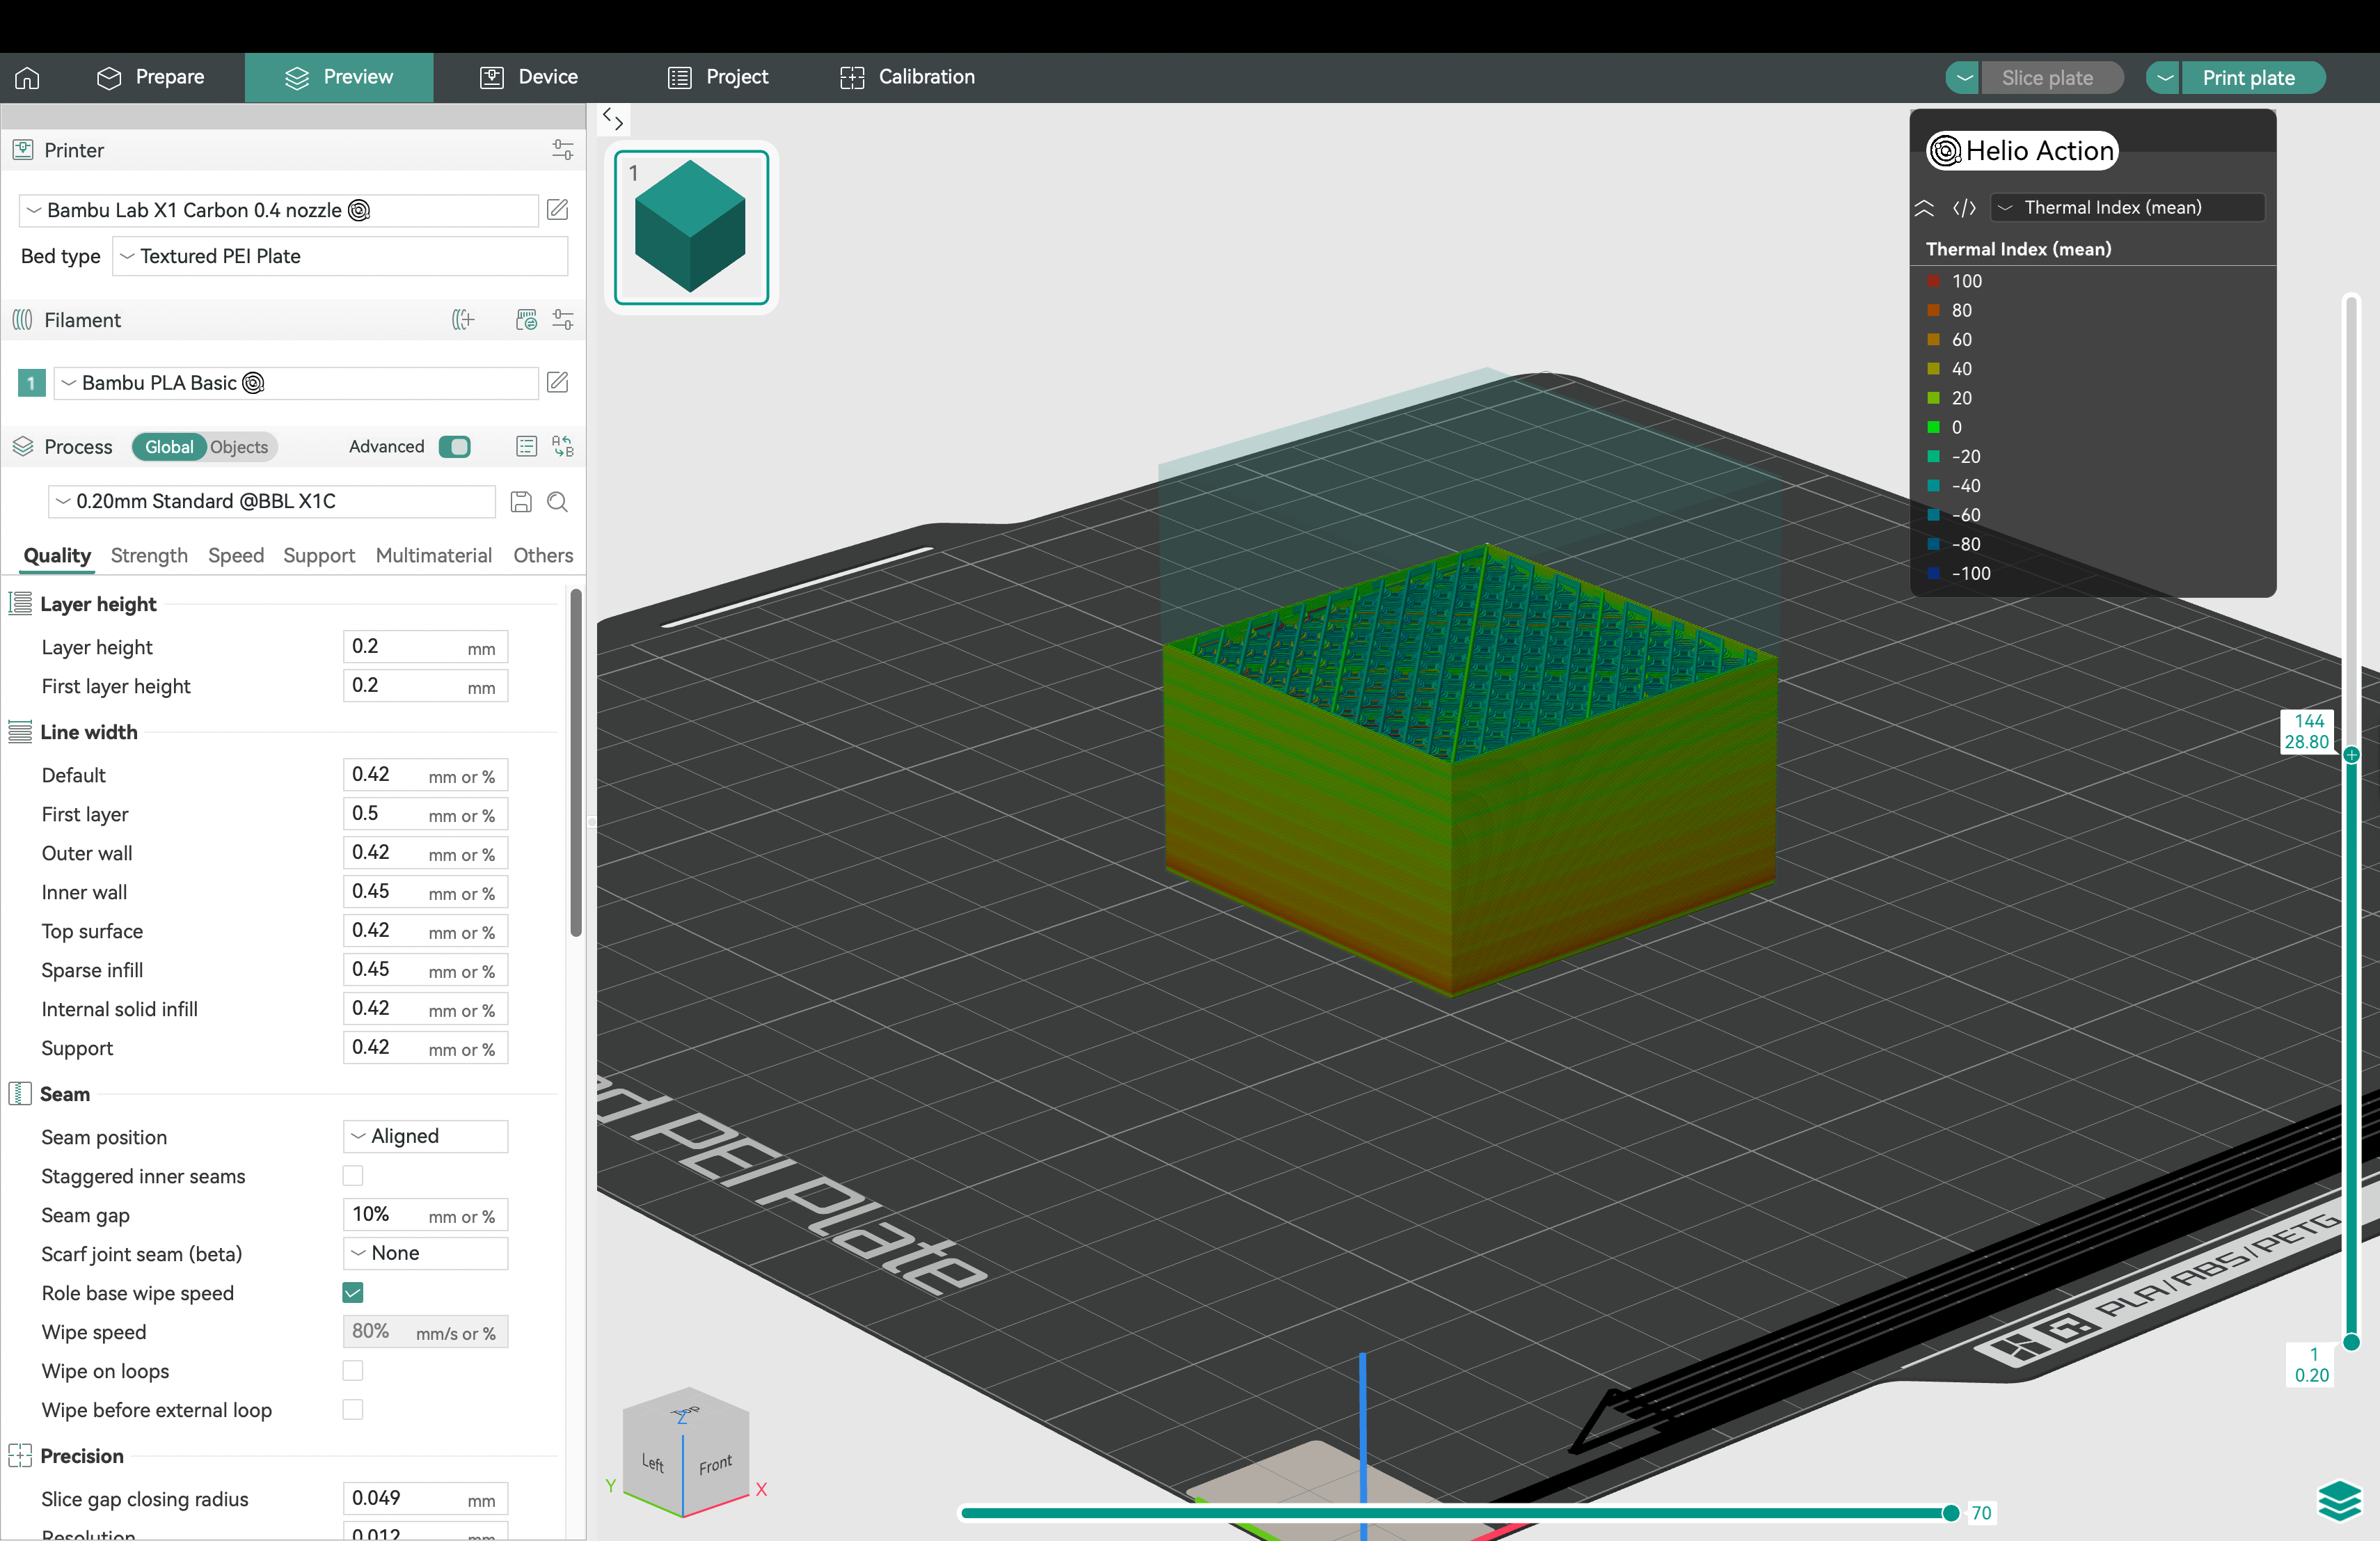
Viewing results
Section titled “Viewing results”Once the simulaion is done running, OrcaSlicer loads the simulated G-code displays the thermal quality index(TQI) on a color scheme, ranging from blue (too cold) to red (too hot).
View the results layer-by-layer:
Optimising (Coming Soon)
Section titled “Optimising (Coming Soon)”If you’re on a paid subscription, you can send your G-code directly from Orca Slicer to Dragon for optimisation. For more details on optimsied G-codes, see the section on G-code analysis
Sending to the printer
Section titled “Sending to the printer”For simulations, it is strongly recommended not to send the Helio-annotated G-code directly to your printer. The file size can become significantly larger due to added comments for thermal visualization.
If you’re satisfied with the optimisation, we suggest performing one final slice using the Slice plate option and sending that clean G-code to your printer instead.
For optimisations, you will receive two G-code files: one with thermal quality indexes for visualisation in preview tools, and a clean, optimised version without these annotations. The visualisation file is helpful for understanding thermal behaviour, but the clean G-code is the one recommended for sending to your printer.
Can I export simulation results for further analysis?
Section titled “Can I export simulation results for further analysis?”Currently, for our free simulation product, we write our thermal index data into the gcode for easy visualisation the the preview tab. For more detailed data please directly reach out to Helio Additive.
For paid optimizations, you’ll receive two G-code files:
-
One with Thermal Quality Index (TQI) data included for visualization in your slicer
-
One without TQI data, ready to send directly to your printer (recommended, as the annotated version can be too large for printing)
What’s different in the optimised G-code? (Coming Soon)
Section titled “What’s different in the optimised G-code? (Coming Soon)”Dragon optimises your G-code by adjusting layer print speeds to maintain ideal thermal conditions throughout the print.
These speeds are based on either:
-
The minimum and maximum print speeds your printer supports, or
-
Speeds calculated from your flow rate, layer height, and line width (for key printable features like inner walls, outer walls, and infill).
This helps you achieve reliable quality, while making full use of your printer and material’s capabilities.
Is there a command-line interface available?
Section titled “Is there a command-line interface available?”Currently, the integration is primarily GUI-based, but a CLI/SDK version is in development.
How to interpret Thermal Index?
Section titled “How to interpret Thermal Index?”A thermal index of 0 indicates you are in the sweet spot thermally for that material in terms of layer bonding and is visualised by a green colour. A value greater than 0 indicates you are too hot and possible failures could be material deformation or collapse. A value below 0 indicates you are too cold and possible failures include warping or delamination depending on the material. Also note if there is large temperature variations between sections this also indicates a chance of warping or dimensional issues. A good rule of thumb is try achieve limited variations or rapid changes in temperature and get a overall temp as close as possible to 0.
Again interpretation is very material dependent. PLA for example can be printable with lots of cooling and a cold looking simulation maybe ok, however it is very sensitive to overheating so avoid going over a thermal index of 0. Different logic should be applied to higher temperature materials like Polycarbonate where warping is a concern.
A useful flow chart on using thermal simulation to improve your prints is described below:
Can you use the thermal simulation to automatically optimize process parameters like print speed & fan speed?
Section titled “Can you use the thermal simulation to automatically optimize process parameters like print speed & fan speed?”Watch this space.
Are you simulating according to the exact toolpath used?
Section titled “Are you simulating according to the exact toolpath used?”Yes. The exact gcode is the primary input to our simulation as it contains all the critical information related to the process. We do not rely on stl or step files or rough approximations of the process. The simulation is almost a realtime digital twin of the print with sequential time based voxel temperature as output.
How fine is your mesh?
Section titled “How fine is your mesh?”Quite technical but here goes… A 3d print is inherently already discretised into layers, paths, roads, arcs, sections with fans at different %, varying layer height, width, nozzle T etc. We are a few extra levels finer than that to ensure all changes can be captured and allow accuracy of calculation output, whilst also allowing for fast/efficient numerical calculation. We don’t go coarser than the gcode resolution or the print itself because that does not accurately capture the process and leads to error stack up.